Correction
Correction:
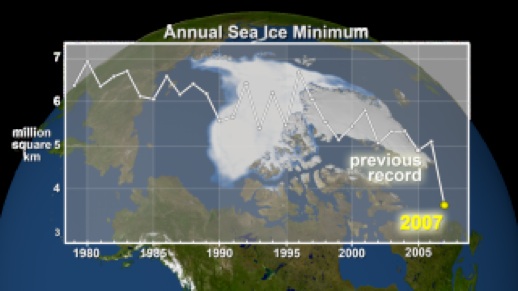
In previous versions of my “A Really inconvenient Truth” talk, but not my Boom or Bust talk, I used an incorrect animation to demonstrate the dramatic melting of the Arctic ice from 1979 to 2007. The animation I used was actually the 2007 maximum to minimum sea ice extent (i.e., one year). The correct animation is available here:
Unfortunately for all of us (and the reason I made the mistake), the 2007 maximum to minimum sea ice extent looks a lot like the 1979 to 2007 yearly minimum sea ice extent! In other words, back in 1979, the minimum sea ice extent (in September) was only slightly smaller than the maximum sea ice extent in 2007, and the progression of year-to-year minimums looks a lot like the 2007 max to min melting! The end points of both animations (2007 minimum sea ice extent) are the same in both animations. The still frame following the animation in the talk, comparing the average minimum extent with the 2005 and 2007 minimums, is correct.
While sea ice extent has recovered somewhat in 2008 and 2009, the amount of “multi-year” (i.e., thicker) ice continues to diminish, so it is estimated that the volume of ice in 2008 was actually less than 2007. You can visit the National Snow and Ice Data Center to track sea ice extent on a daily basis.
The basic assertion in my talk that the Arctic will be mainly ice free in the summer in 10 years -- if not less --, unfortunately, still appears to be true. And to tie into another part of my talk, loss of Arctic sea ice is linked to accelerated melting of permafrost.
I apologize for the error. If you spot other errors in my talk, please contact me.

